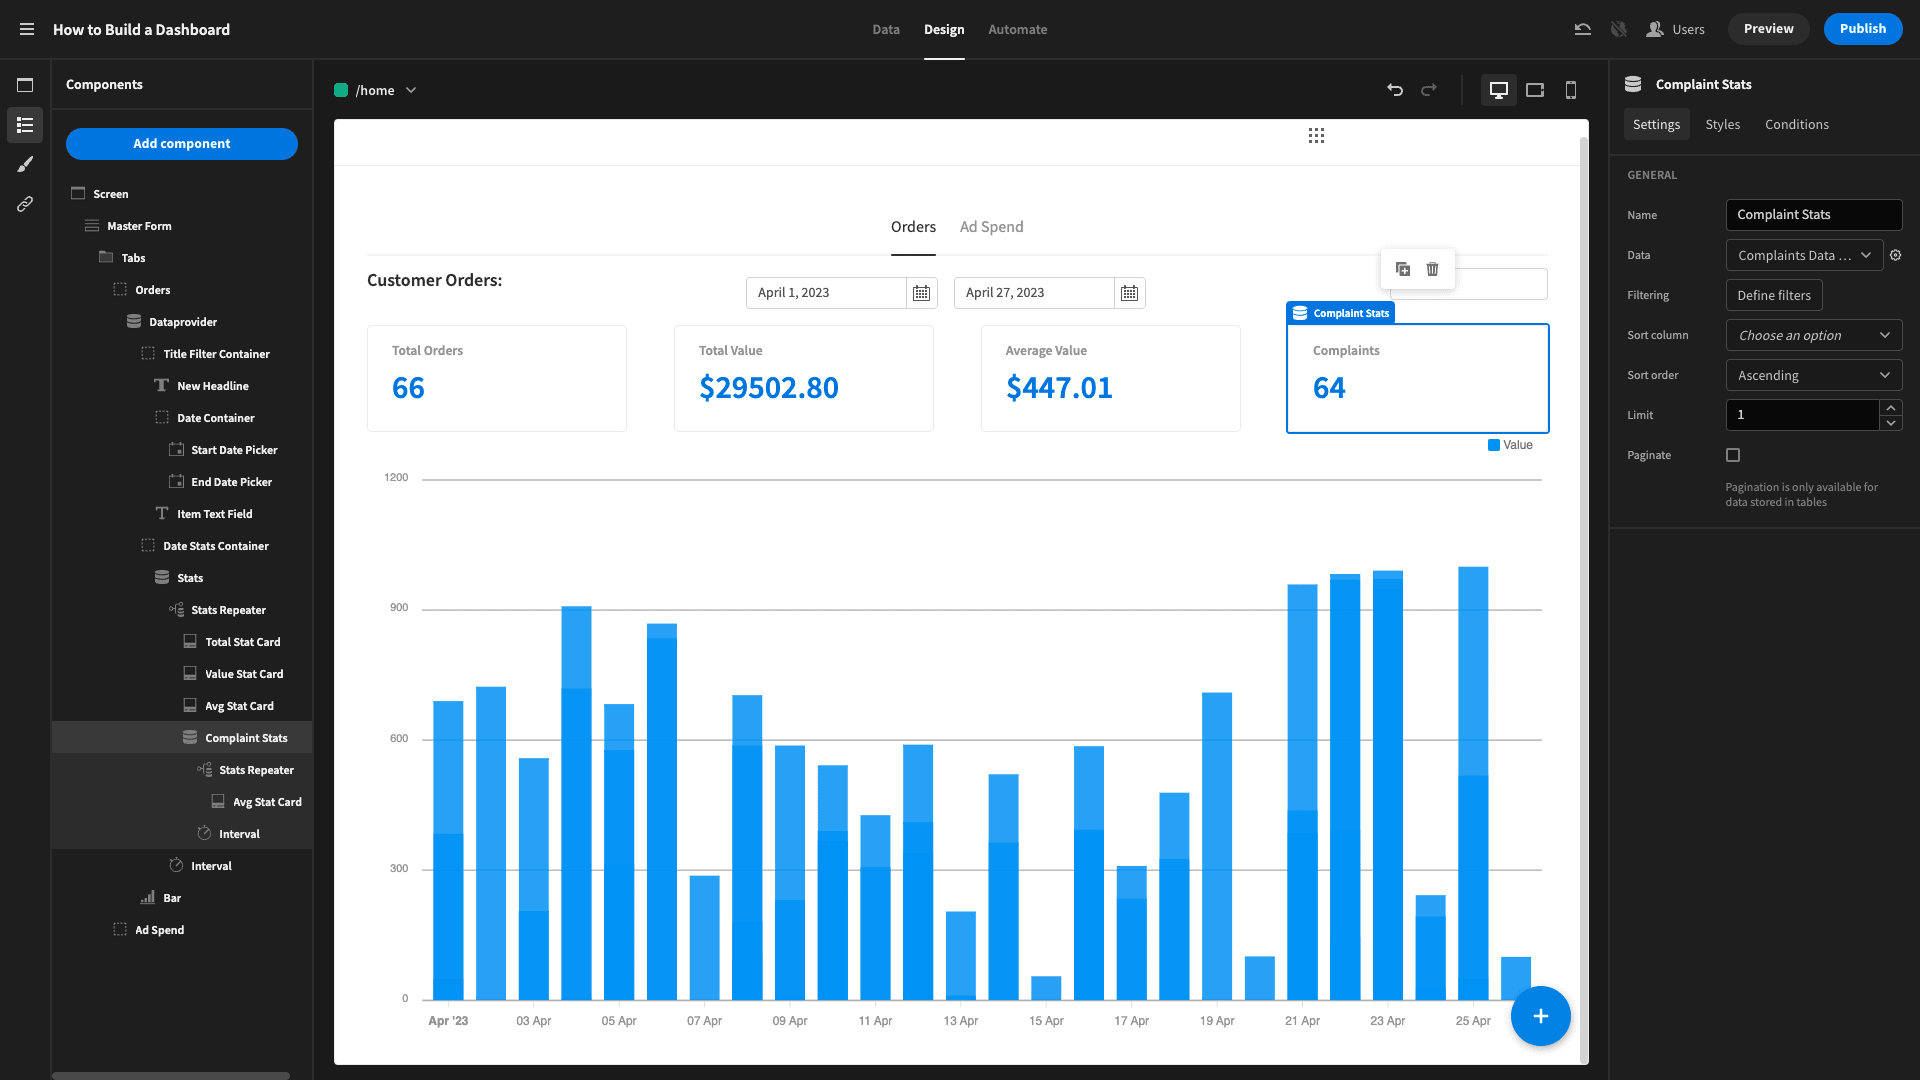
Building Your First Data Dashboard: A Step-by-Step Guide
In today’s data-driven world, having a well-structured data dashboard is essential for making informed decisions. Whether you’re tracking business metrics, analyzing sales trends, or monitoring website performance, a dashboard helps visualize key insights in real time. If you’re new to building dashboards, this guide will walk you through the process step by step.
Step 1: Define Your Goals
Before jumping into design, identify the purpose of your dashboard. Ask yourself:
- What key metrics do I need to track?
- Who will use this dashboard?
- What decisions will be made based on this data?
Clear goals will help you choose the right data sources and visualizations.
Step 2: Choose the Right Tool
There are many tools available for building dashboards. Your choice depends on your technical expertise and data needs. Popular options include:
- Tableau – Great for business intelligence and interactive visualizations.
- Power BI – Ideal for integrating with Microsoft products and enterprise-level reporting.
- Google Data Studio – Best for free, web-based reporting.
- Excel – Simple yet effective for small-scale dashboards.
- Python (Dash, Streamlit) – Best for custom dashboards with data science applications.
Step 3: Gather and Connect Your Data
A dashboard is only as good as the data behind it. Ensure your data is accurate, clean, and updated regularly. Common data sources include:
- Databases (SQL, MongoDB)
- Spreadsheets (Excel, Google Sheets)
- APIs (Google Analytics, CRM systems)
- Cloud platforms (AWS, Google Cloud, Azure)
Step 4: Design Your Dashboard Layout
An effective dashboard should be clear, simple, and actionable. Follow these best practices:
- Prioritize key metrics (KPIs) at the top.
- Use charts and graphs for quick insights (bar charts, line graphs, heat maps).
- Keep it uncluttered—avoid too many visuals in one view.
- Ensure mobile responsiveness for accessibility on all devices.
Step 5: Add Filters & Interactivity
Enhance your dashboard’s usability by allowing users to filter data by date, category, or region. Interactive elements like dropdowns, sliders, and search fields make it easier to analyze specific data points.
Step 6: Test and Optimize
Before rolling out your dashboard, test it with real users. Ensure:
- Data updates correctly in real-time.
- Load times are fast and responsive.
- Insights are easy to interpret at a glance.
Step 7: Share and Maintain Your Dashboard
Once finalized, deploy your dashboard and provide access to relevant stakeholders. Regularly update and refine it based on user feedback to ensure continued relevance.
Get Expert Help from I4 Tech Integrated Service
Building a dashboard can be overwhelming, but you don’t have to do it alone. At I4 Tech Integrated Service, we specialize in custom dashboard development, data visualization, and analytics solutions. Whether you need help choosing the right tool or building a high-performance dashboard, we’ve got you covered.


